
How to Import Excel into Fabric?
Recently, I had a situation where I needed to combine some data from an Excel file with the tables I already had inside a lakehouse. At first, I wasn’t sure what the best approach was—should I upload the file directly, or try to read it from a notebook? That’s when I realized many people run into the same question: how to import Excel into Fabric. The good news is that Microsoft Fabric makes this process much easier than you might expect, whether you’re working with Excel or CSV files.
First thing you will have to do is to create a workspace. You can see how to do that in one of my previous articles called How to Create a Workspace in Microsoft Fabric.
Create Fabric Lakehouse
Next thing you have to do is to create a Lakehouse. A lakehouse is where your structured (tables) and unstructured (files) data live together.
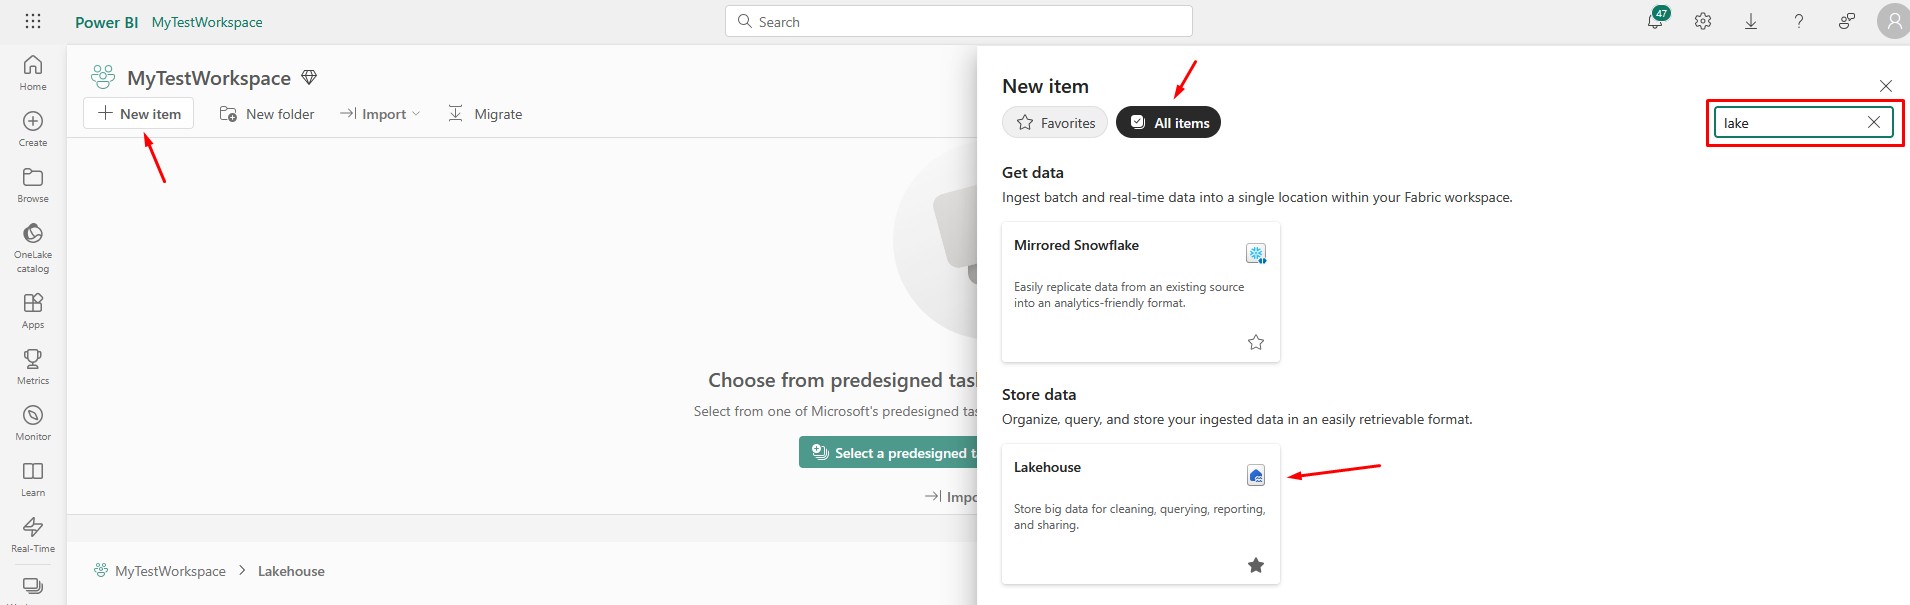
Go to your new Workspace, create and/or find the folder where you want to create the lakehouse, click New item, go to All items, and search for Lakehouse option:
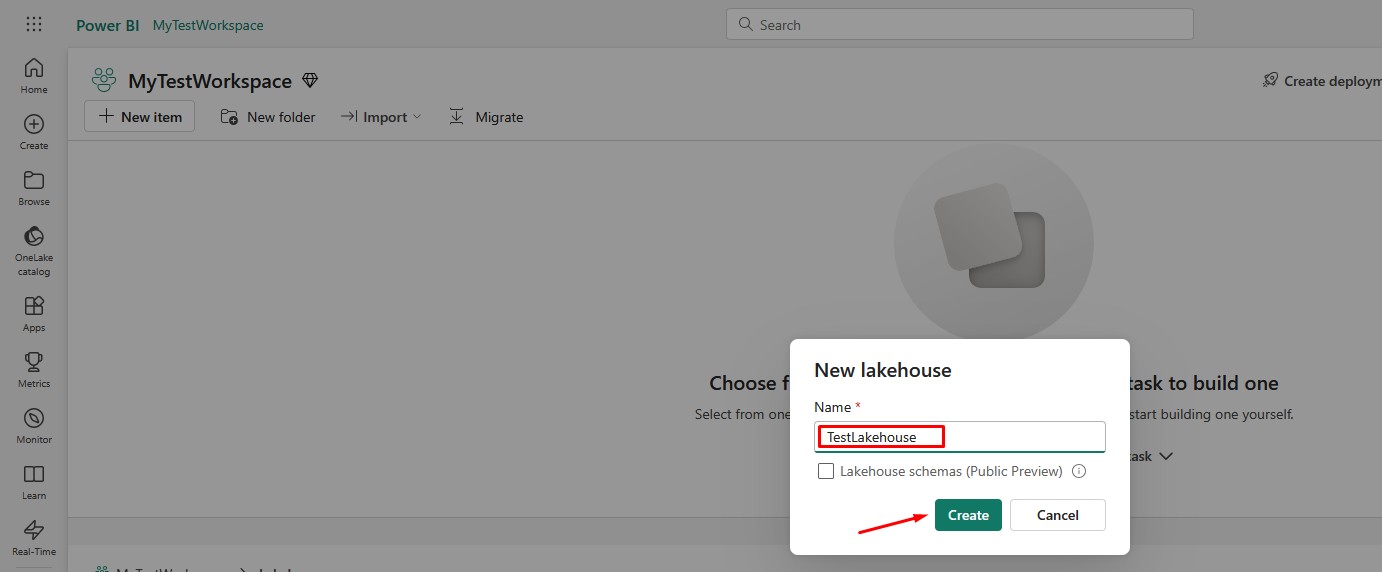
After you click it, you will have to choose the name for your Lakehouse. Select the desired name and click Create:
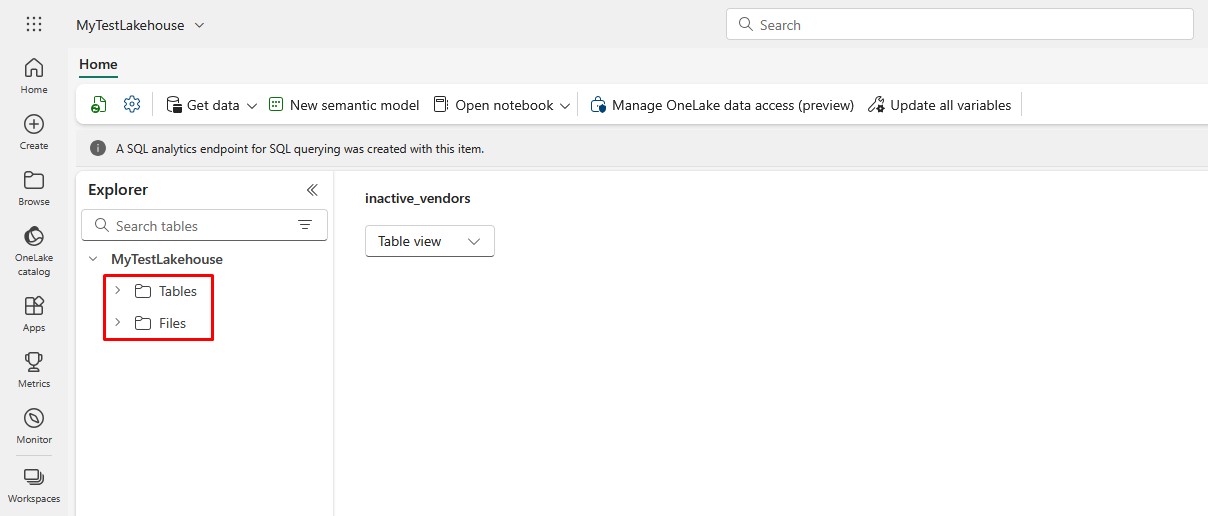
Once the lakehouse is created, you’ll see two sections: Tables and Files. This is important because when you upload Excel or CSV files, they first land in the Files area, and from there you can read them into tables:
How Do I Upload Files to Microsoft Fabric?
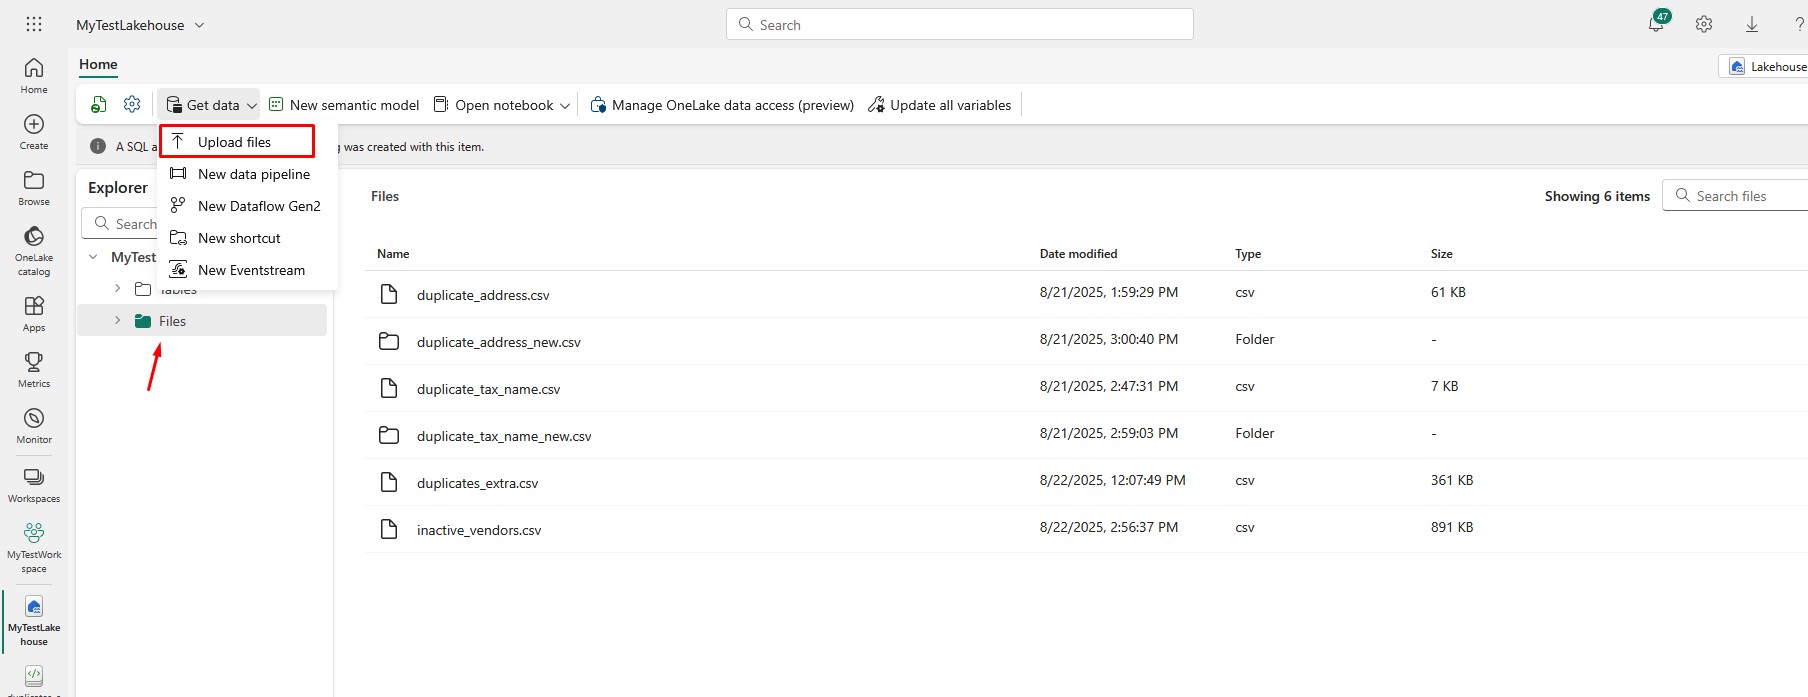
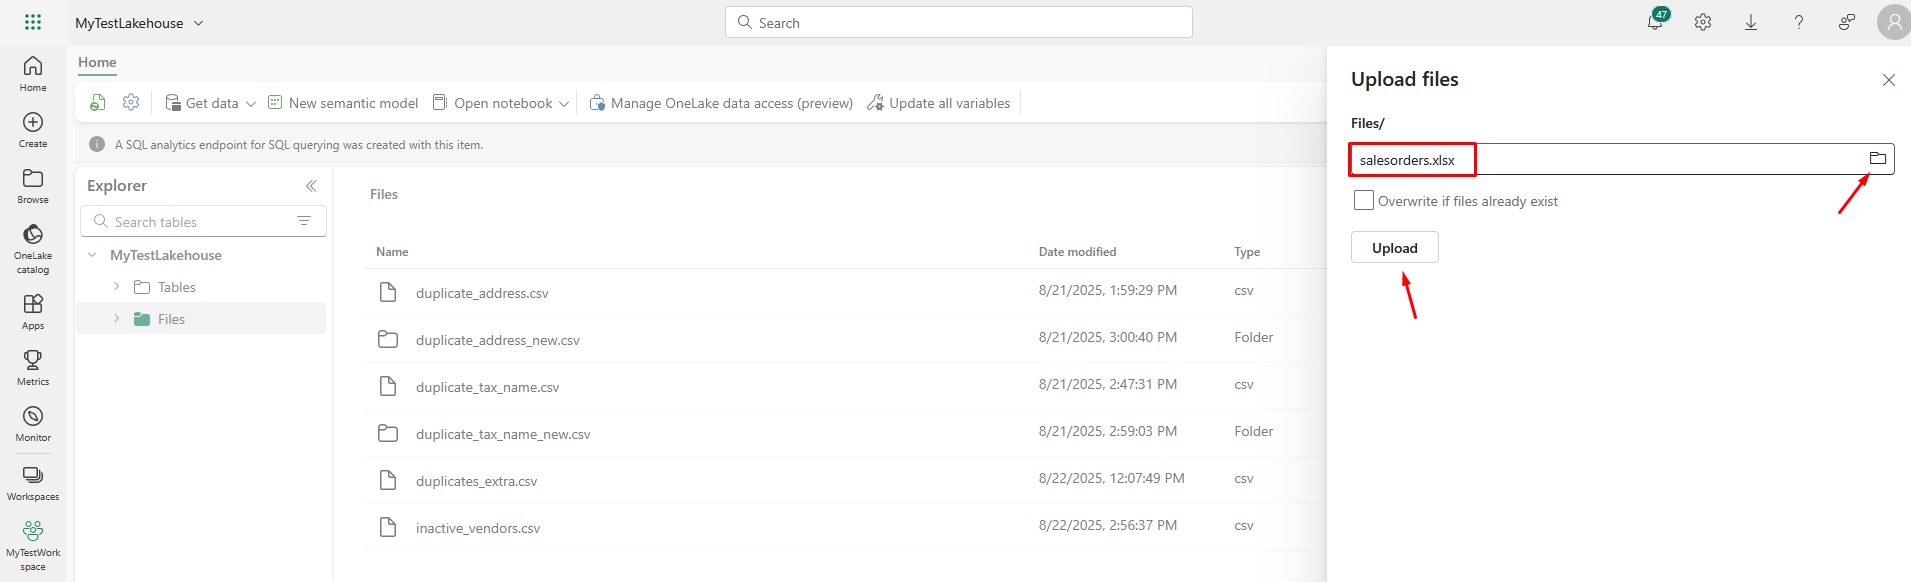
Now that you have your lakehouse, let’s upload a file. You can dowload sample files here. Inside the lakehouse, click on the Files section, click on Get data and then choose the option Upload files:
Find the salesorders.xlsx file, select it and click Upload:
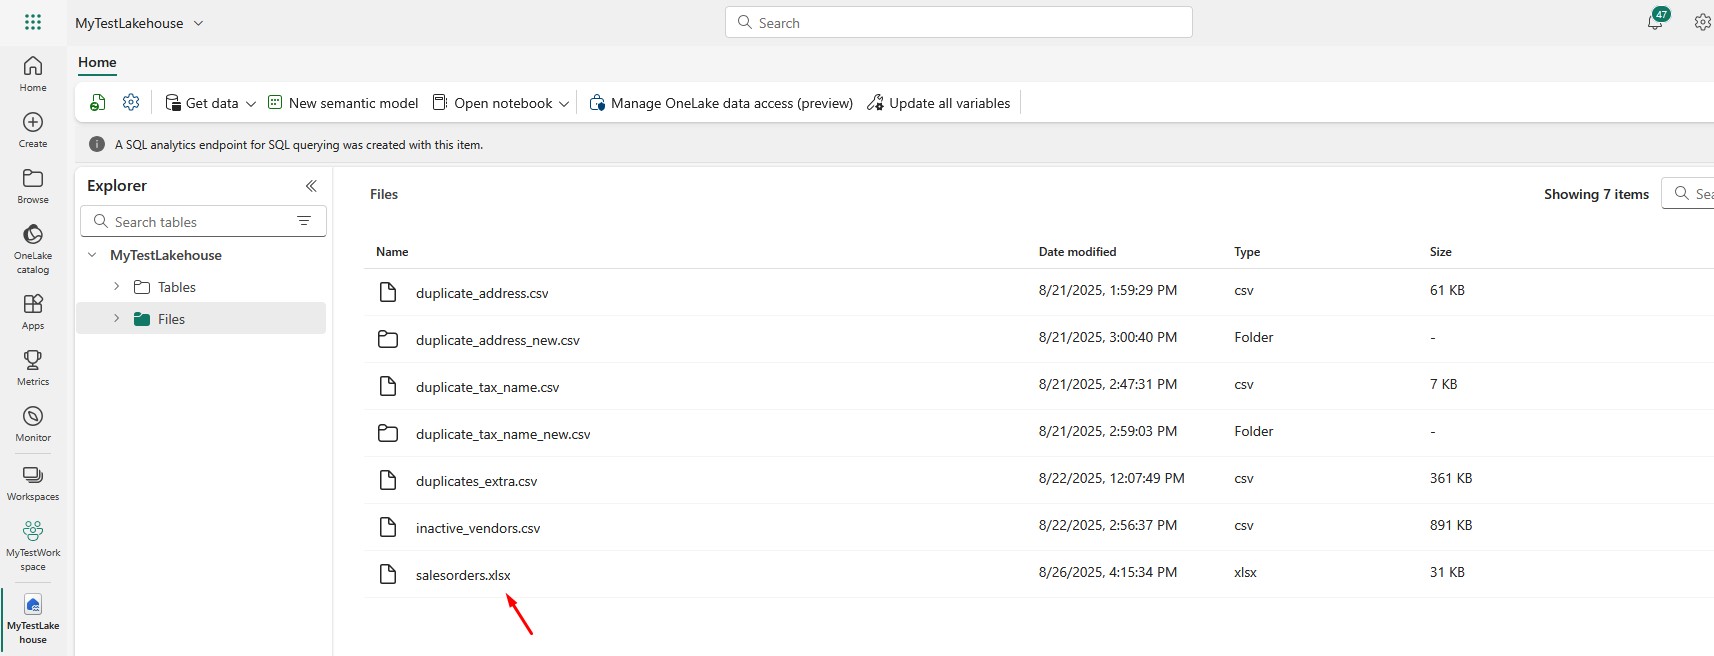
Once uploaded, you’ll see it under Files:
How to Read Excel File in Fabric Notebook
After uploading the file, you can open a Fabric Notebook to read the Excel file with Python. The great thing is that Fabric already comes with popular libraries like Pandas pre-installed.
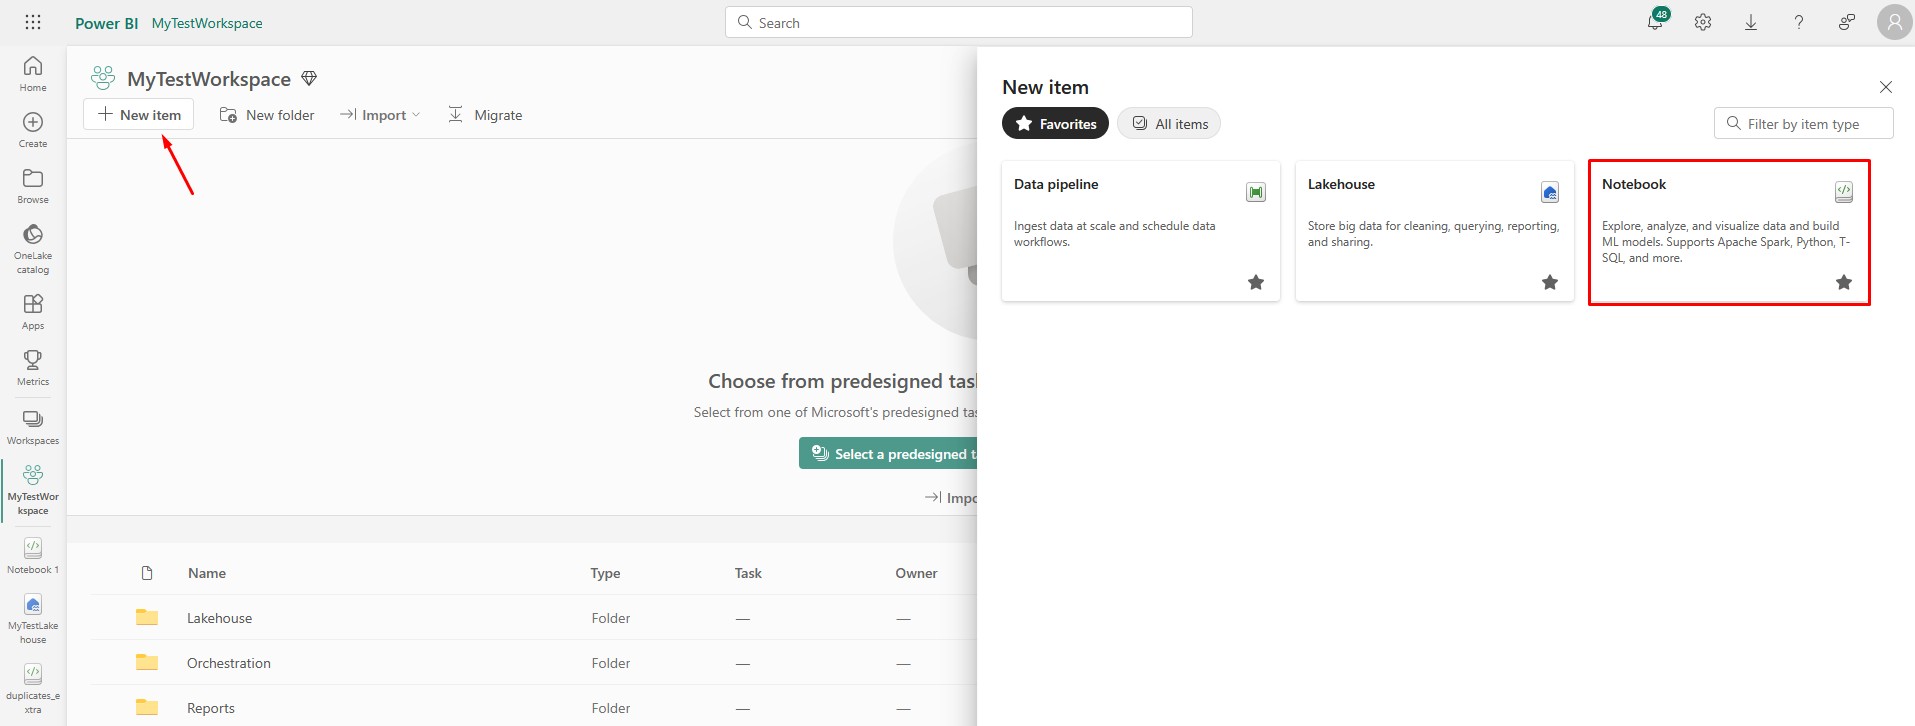
Go to your Workspace, click on New item and create a new Notebook:
Rename the Notebook by typing desired name in the upper-left corner:
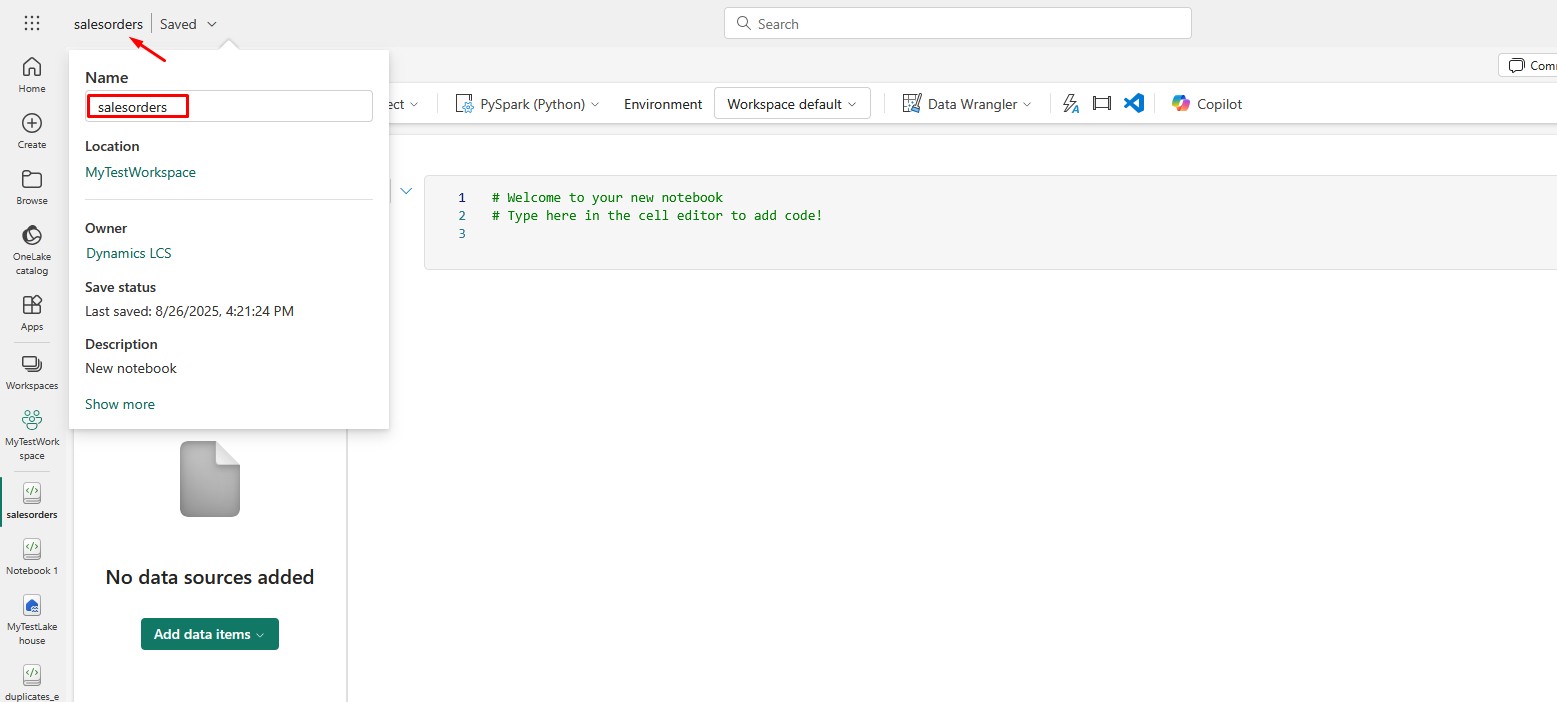
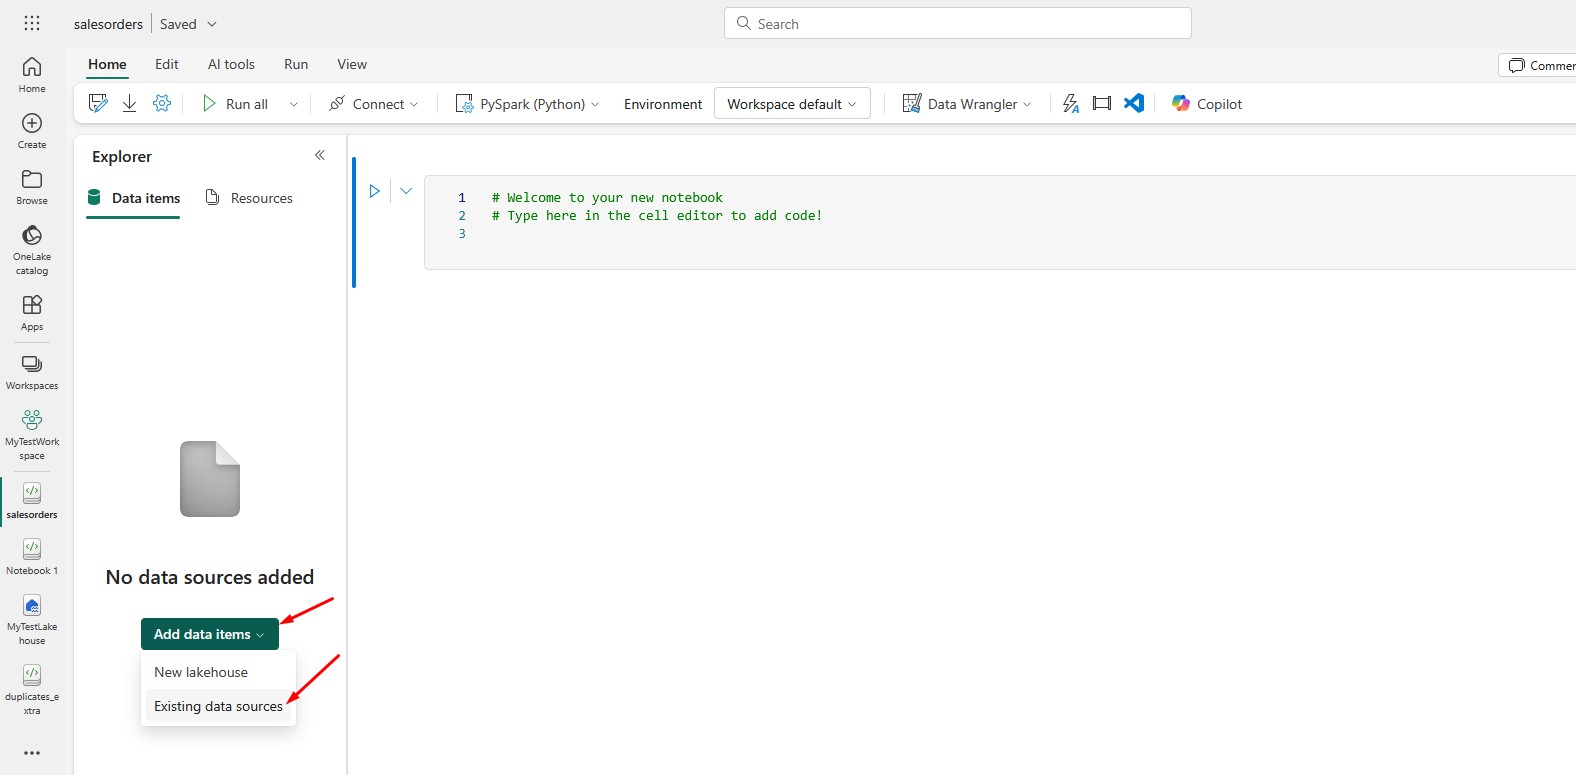
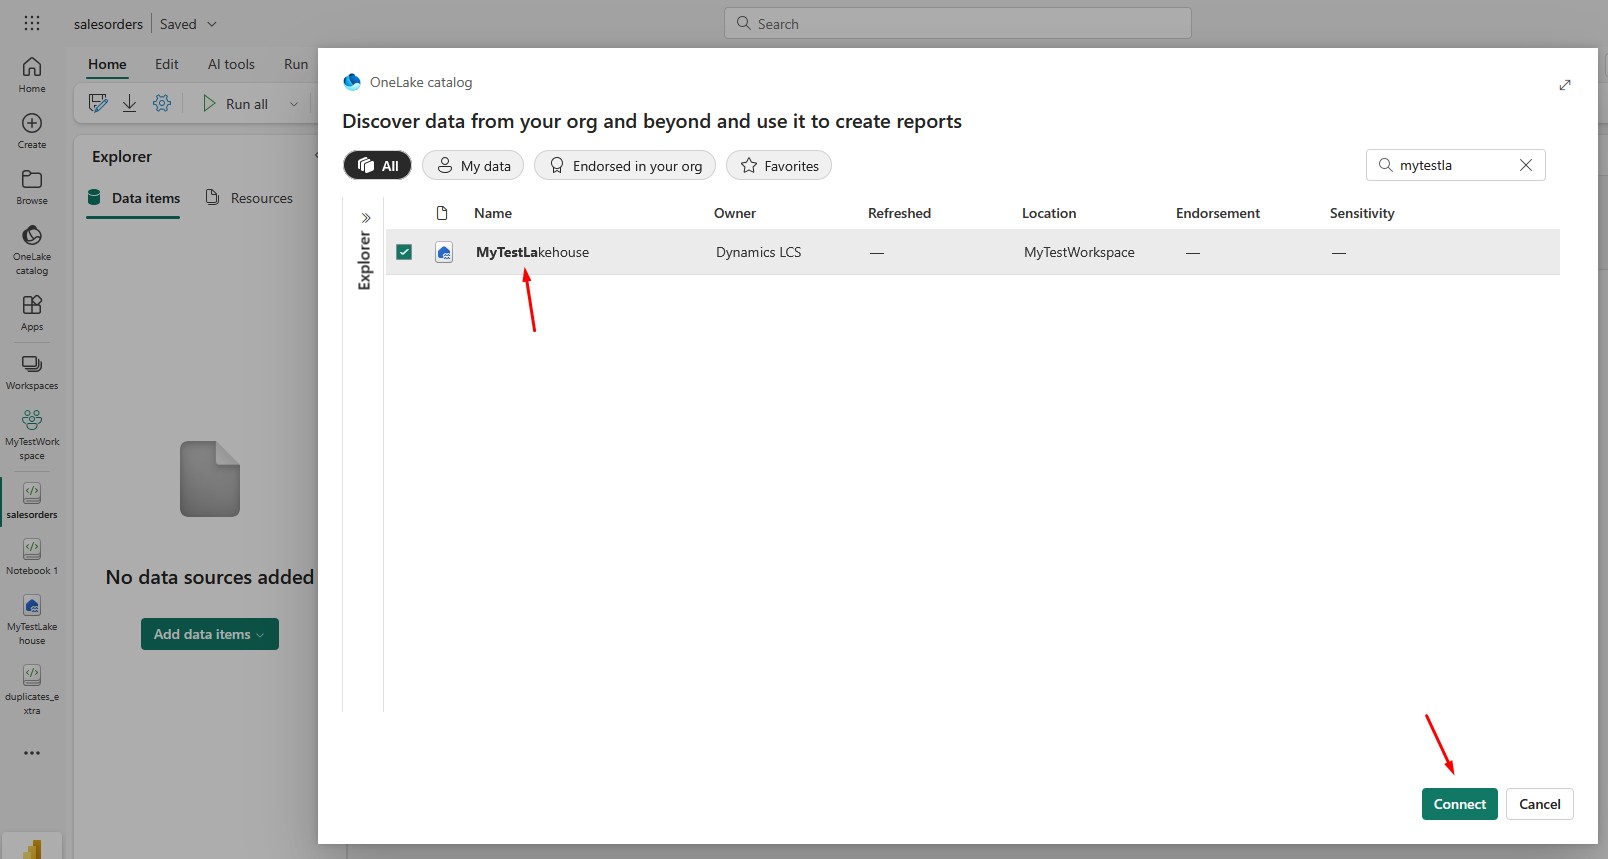
Choose the Lakehouse you created earlier as a data source:
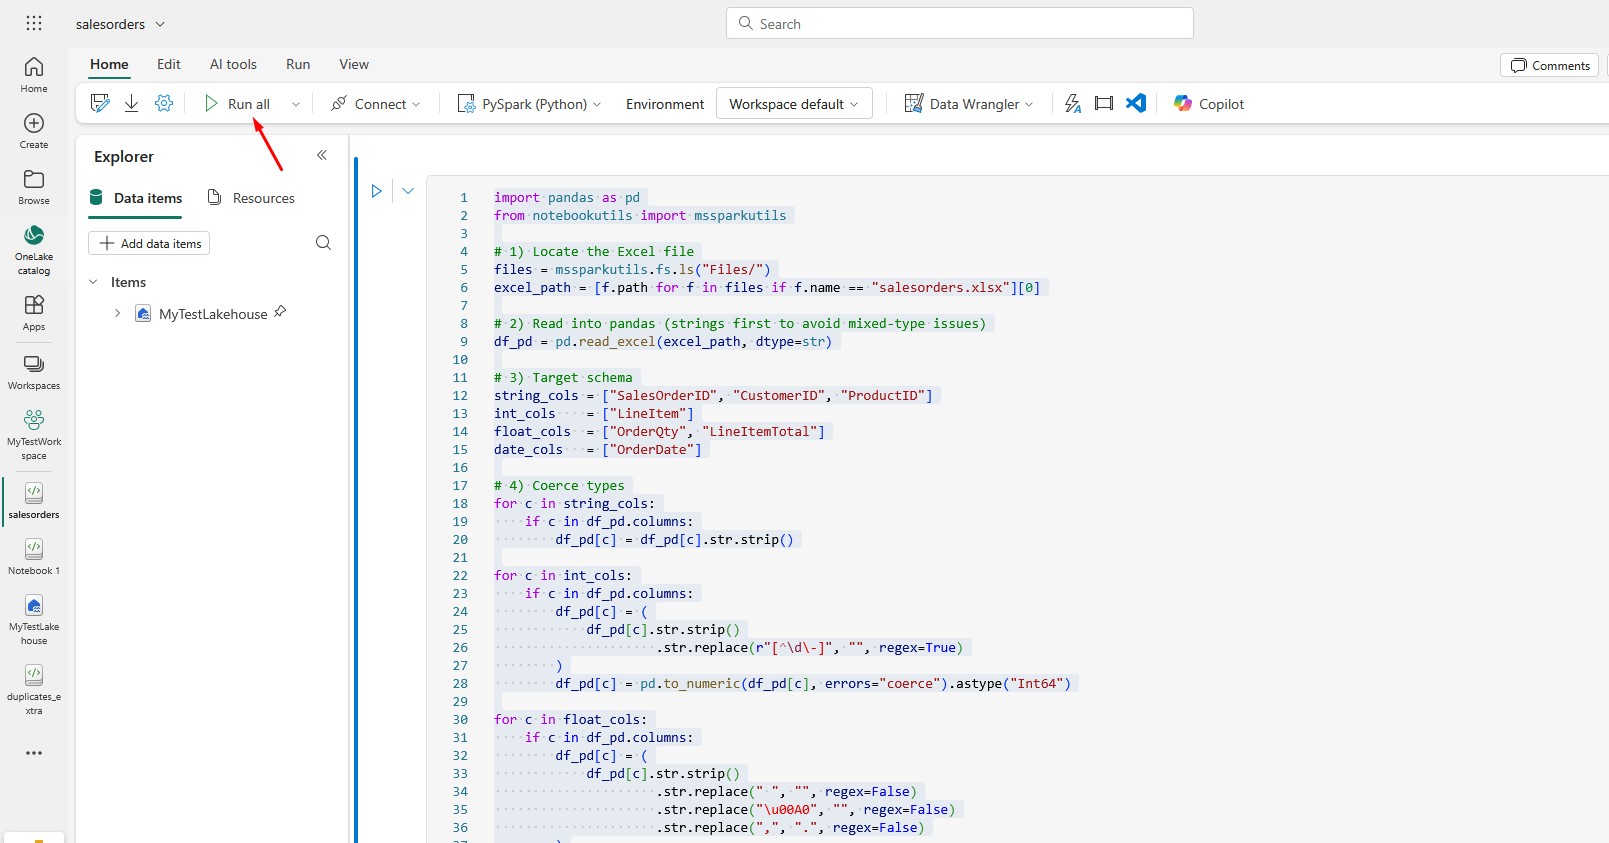
Here’s a piece of code that reads the uploaded Excel file and creates a lakehouse table:
import pandas as pd
from notebookutils import mssparkutils

# 1) Locate the Excel file
files = mssparkutils.fs.ls("Files/")
excel_path = [f.path for f in files if f.name == "salesorders.xlsx"][0]

# 2) Read into pandas (strings first to avoid mixed-type issues)
df_pd = pd.read_excel(excel_path, dtype=str)

# 3) Target schema
string_cols = ["SalesOrderID", "CustomerID", "ProductID"]
int_cols    = ["LineItem"]
float_cols  = ["OrderQty", "LineItemTotal"]
date_cols   = ["OrderDate"]

# 4) Coerce types
for c in string_cols:
    if c in df_pd.columns:
        df_pd[c] = df_pd[c].str.strip()

for c in int_cols:
    if c in df_pd.columns:
        df_pd[c] = (
            df_pd[c].str.strip()
                     .str.replace(r"[^\d\-]", "", regex=True)
        )
        df_pd[c] = pd.to_numeric(df_pd[c], errors="coerce").astype("Int64")

for c in float_cols:
    if c in df_pd.columns:
        df_pd[c] = (
            df_pd[c].str.strip()
                     .str.replace(" ", "", regex=False)
                     .str.replace("\u00A0", "", regex=False)
                     .str.replace(",", ".", regex=False)
        )
        df_pd[c] = pd.to_numeric(df_pd[c], errors="coerce")

for c in date_cols:
    if c in df_pd.columns:
        # Removed infer_datetime_format (deprecated)
        df_pd[c] = pd.to_datetime(df_pd[c], errors="coerce")
        # If your dates are European-style (e.g., 31/12/2024), you can use:
        # df_pd[c] = pd.to_datetime(df_pd[c], errors="coerce", dayfirst=True)

# Replace NaN/NaT with None for Spark
df_pd = df_pd.where(df_pd.notna(), None)

# 5) To Spark + write as Delta
result_df = spark.createDataFrame(df_pd)
result_df.write.format("delta").mode("overwrite").option("overwriteSchema", "true").saveAsTable("salesorders")
How it works:
mssparkutils.fs.ls("Files/")lists everything in your Lakehouse Files folder (returns items with.nameand.path).[f.path for f in files if f.name == "salesorders.xlsx"][0]filters that list to the Excel file and grabs its full OneLake path.pd.read_excel(excel_path, dtype=str)reads the Excel into Pandas as strings first to avoid mixed-type issues.- For string columns (
SalesOrderID,CustomerID,ProductID) trims whitespace so values are clean. - For integer column (
LineItem) strips non-digits, converts to numeric, then to nullable Int64 (so blanks become nulls, not 0). - For numeric columns (
OrderQty,LineItemTotal) normalizes spaces and comma/decimal separators, then converts to floats. - For date column (
OrderDate) parses text to real datetime; invalid dates becomeNaT(later turned into null). df_pd = df_pd.where(df_pd.notna(), None)replacesNaN/NaTwithNoneso Spark gets proper null values.result_df = spark.createDataFrame(df_pd)converts the cleaned pandas DataFrame to a Spark DataFrame.result_df.write.format("delta").mode("overwrite").option("overwriteSchema","true").saveAsTable("salesorders")writes it as a Delta table in your lakehouse (table name:salesorders).
Run the code first:
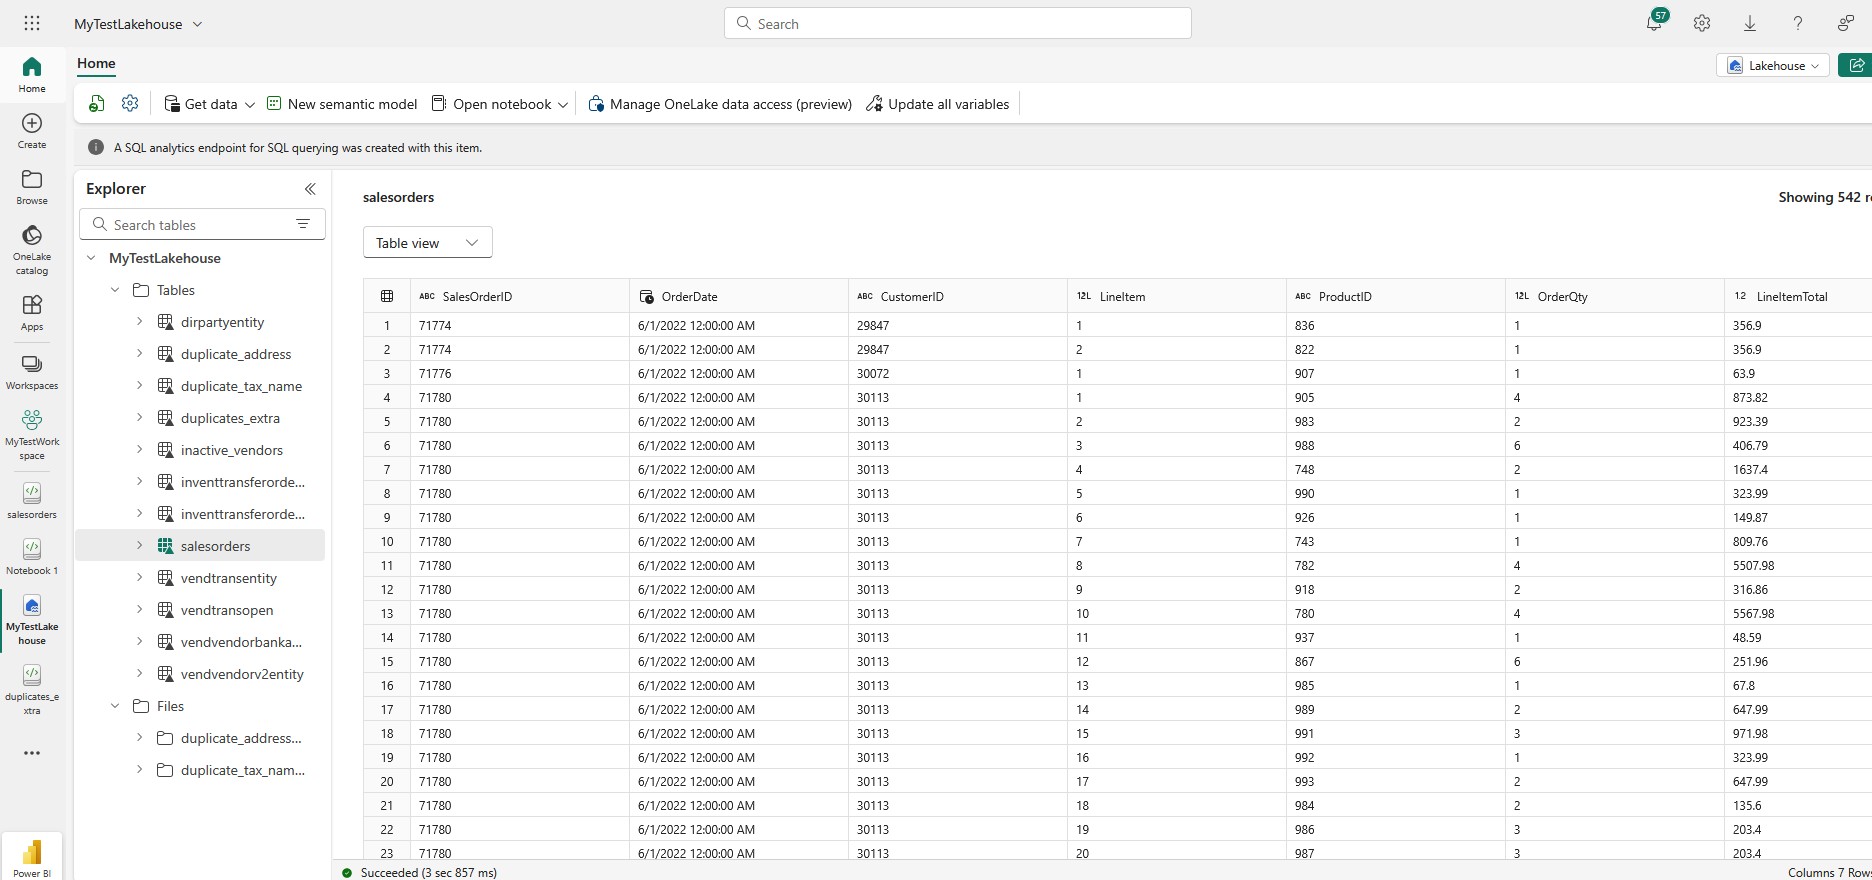
If you check the Lakehouse, you will see that the table has been created, and the data is there:
Microsoft Fabric Upload CSV with Dataflows Gen2
If you’re working with CSV files, you don’t always need a notebook. Microsoft Fabric also provides Dataflows Gen2, which allows you to visually transform and load data into tables. We will do this excercise using the orders.csv file you downloaded here.
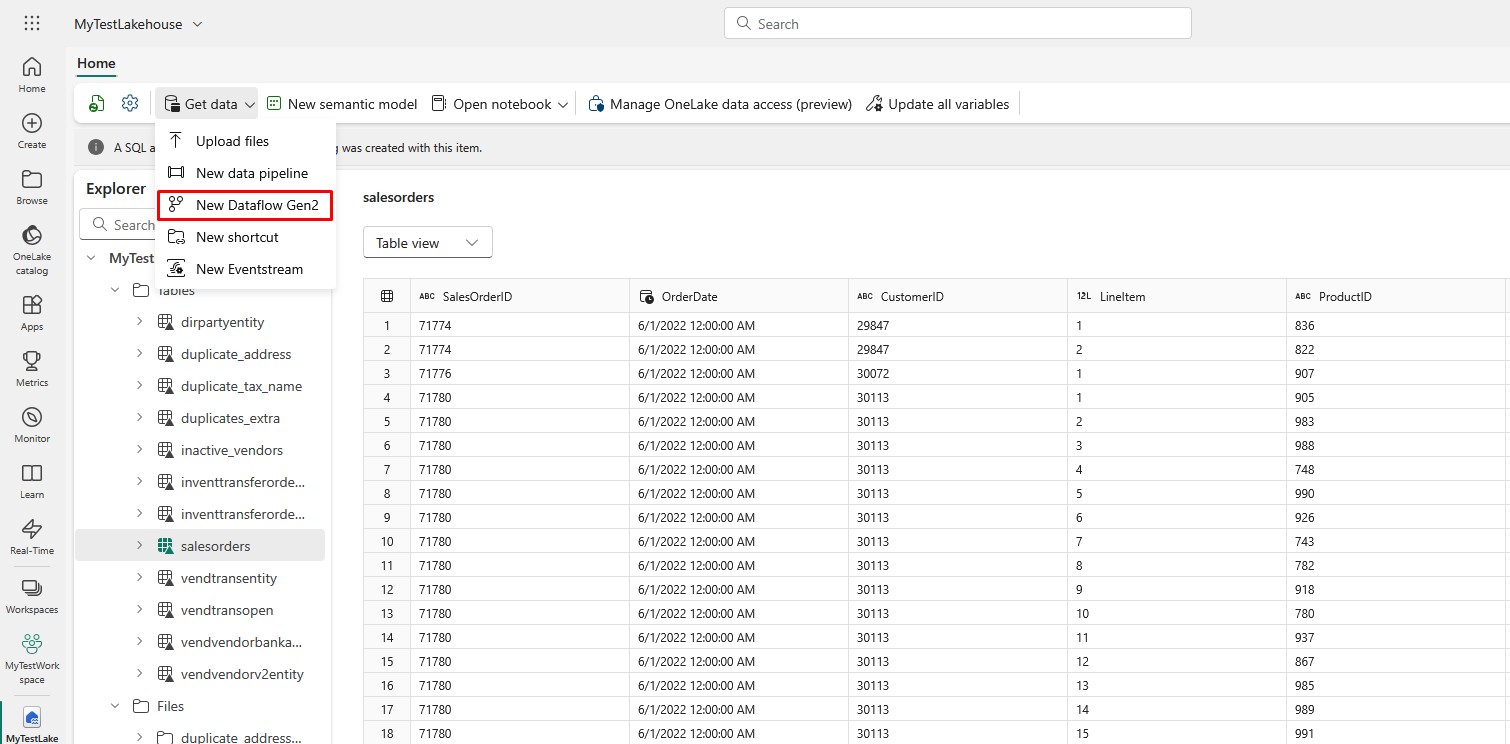
Go to your Lakehouse and click Get Data and then New Dataflow Gen2:
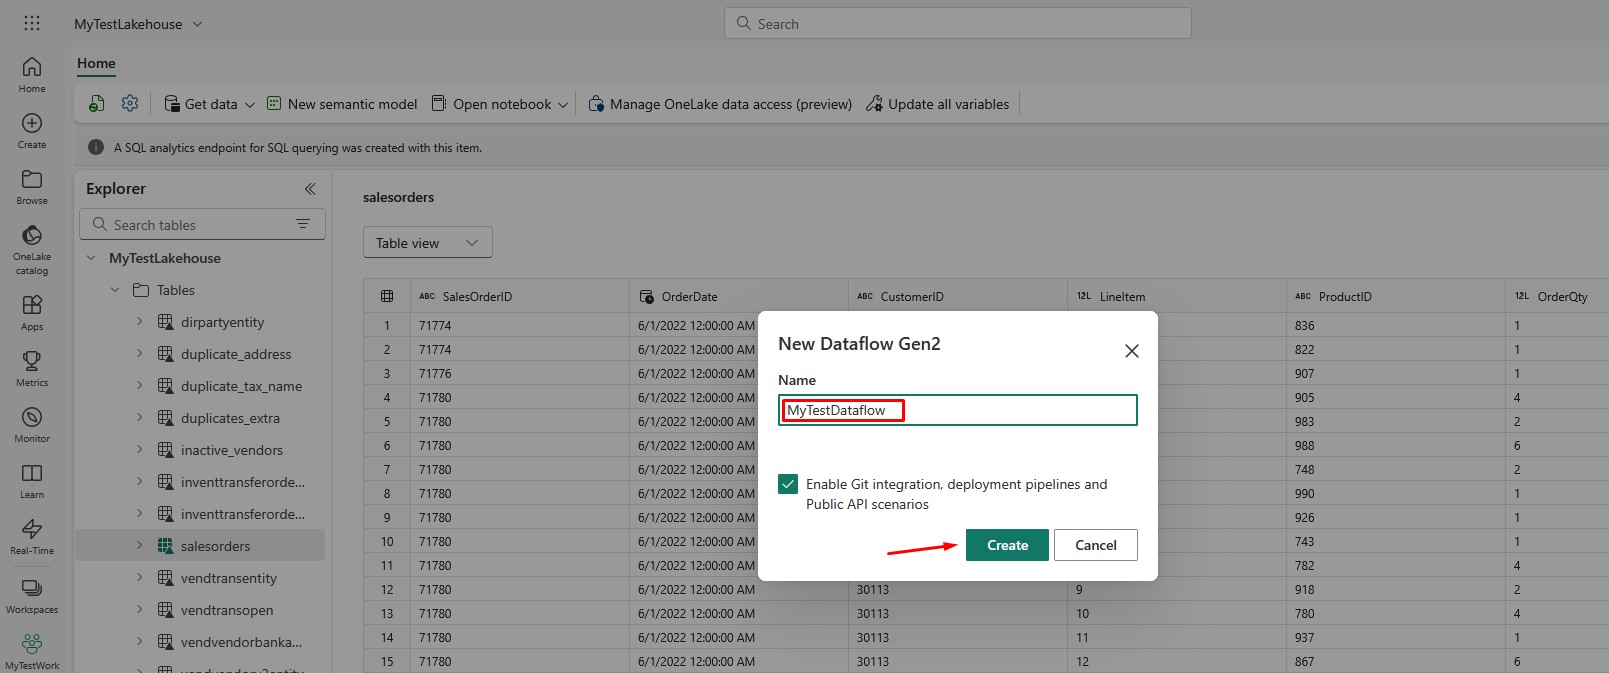
You can call it MyTestDataflow. Click Create when you are ready:
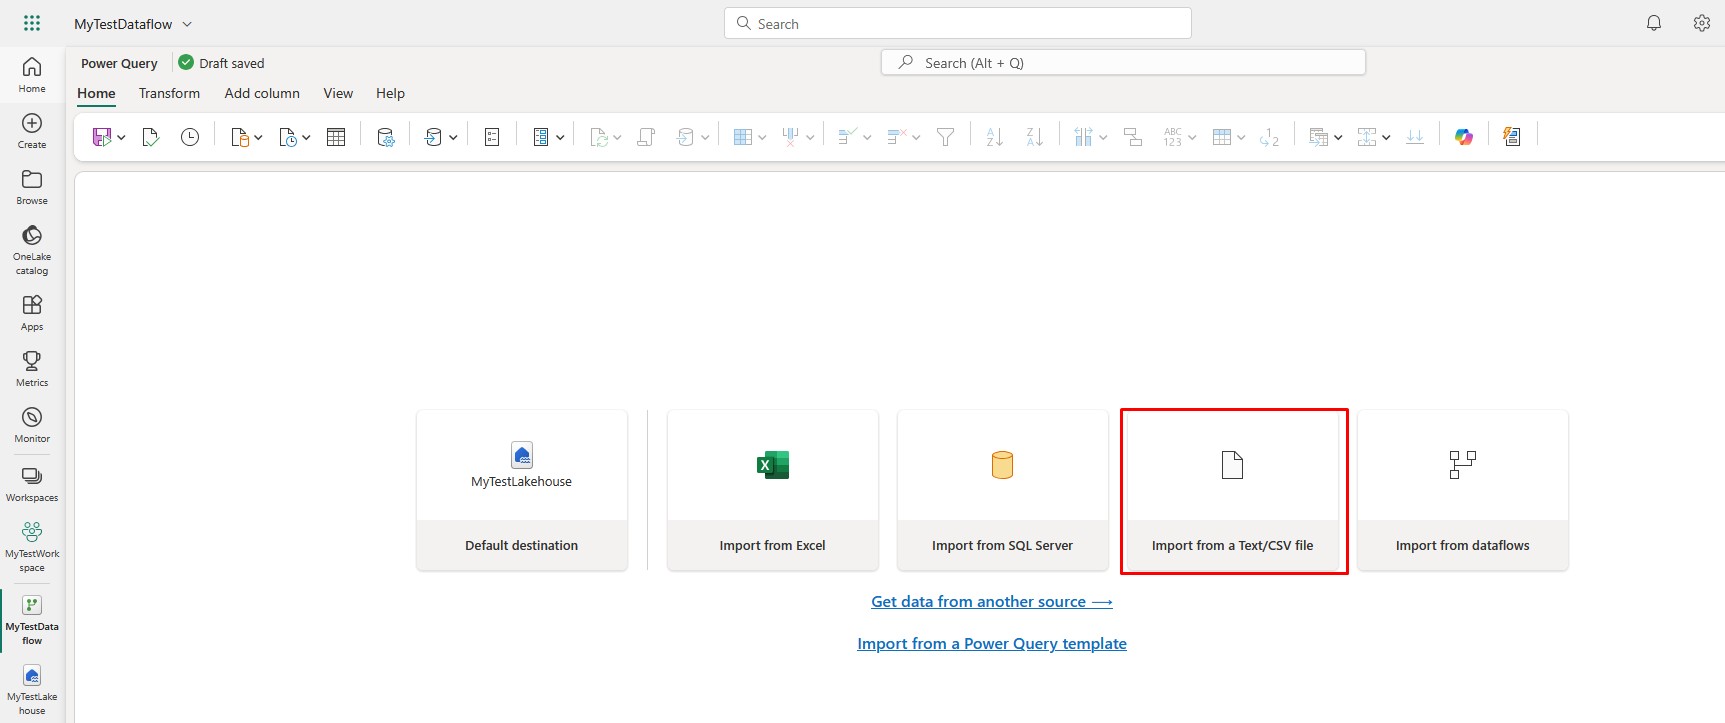
Choose the option Import from a Text/CSV file:
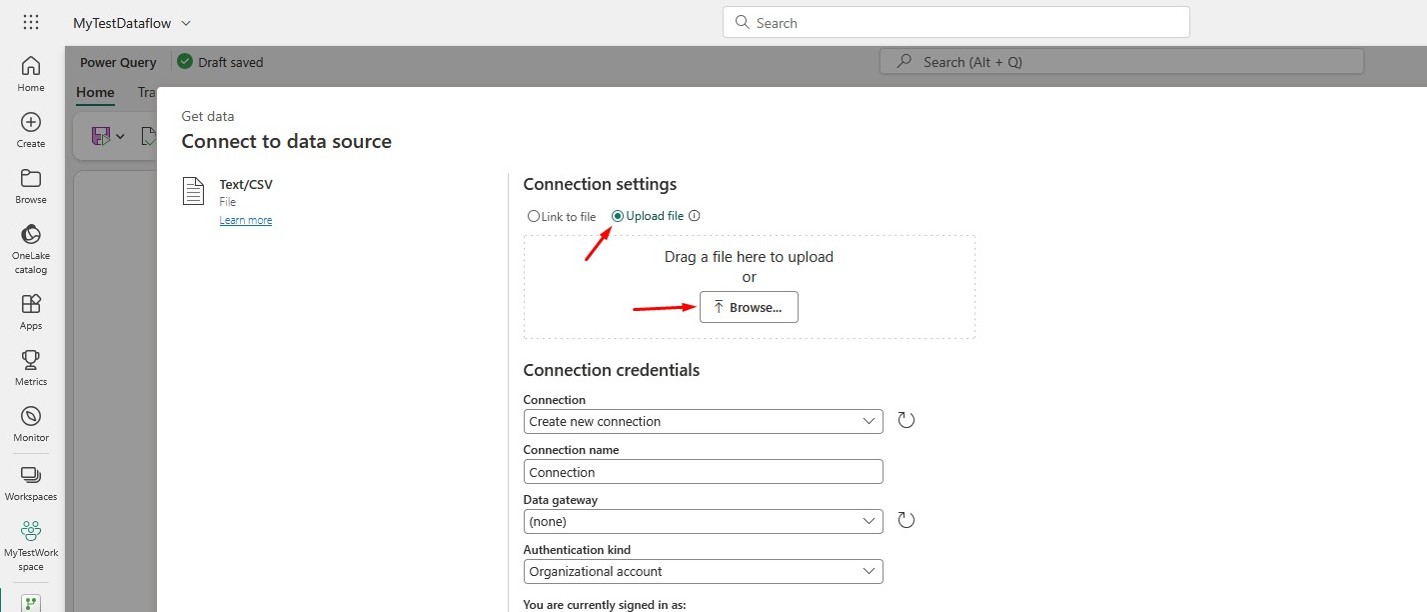
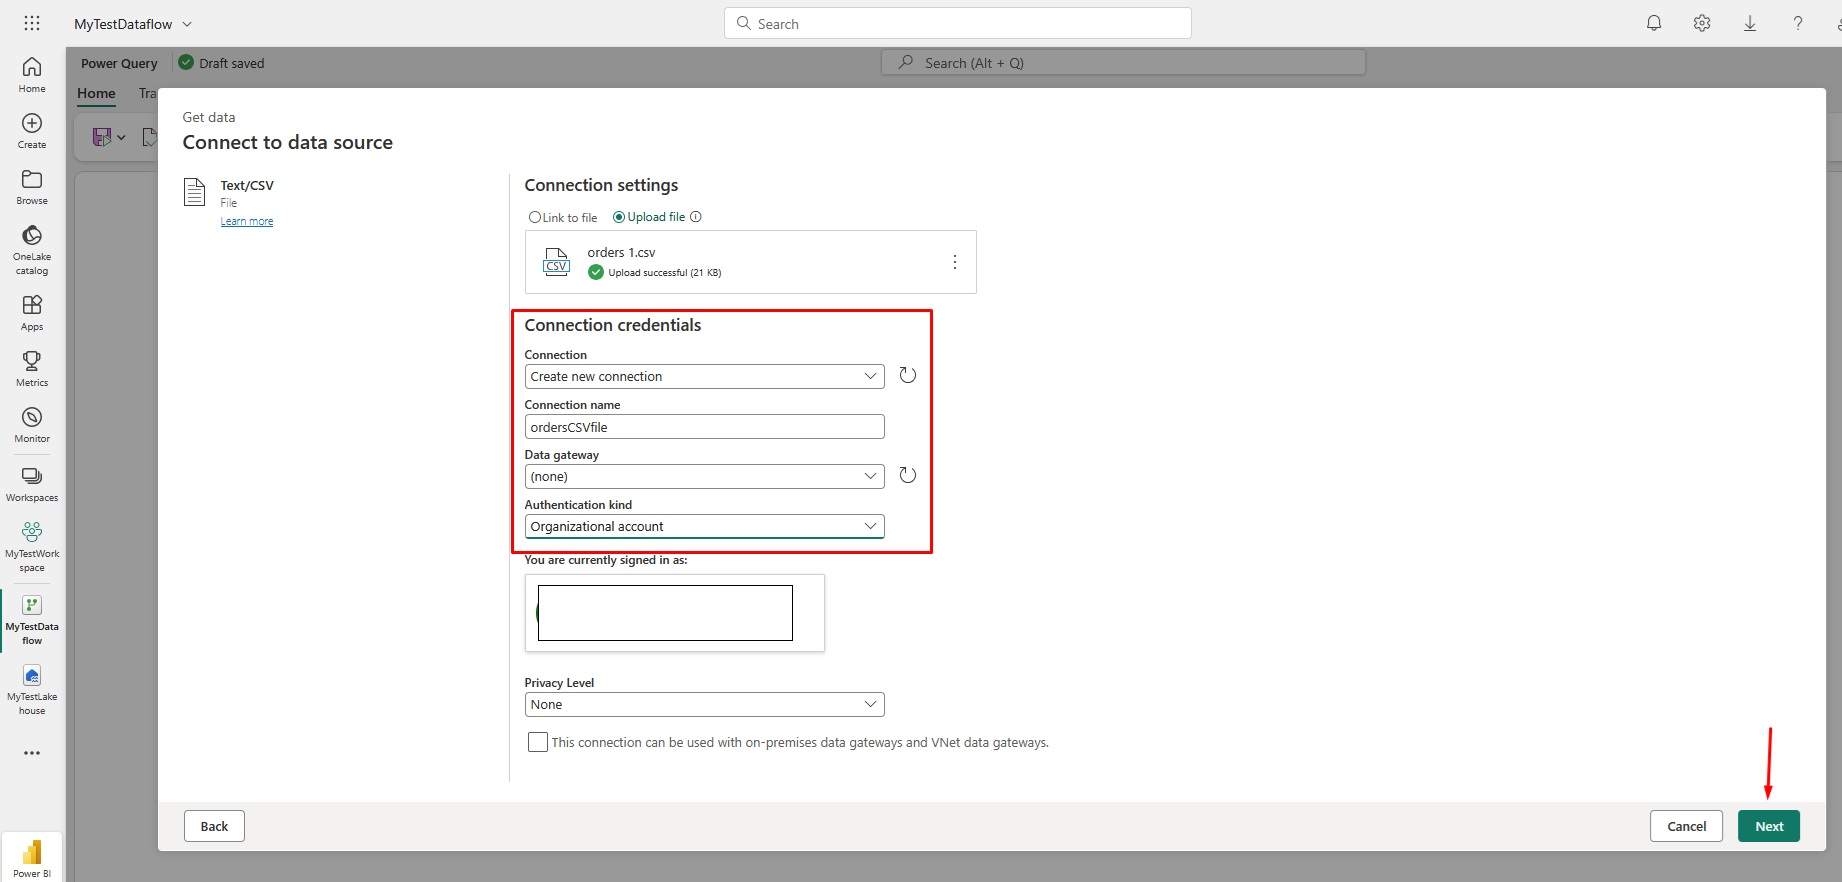
Select the option Upload file and click Browse to select the orders.csv file:
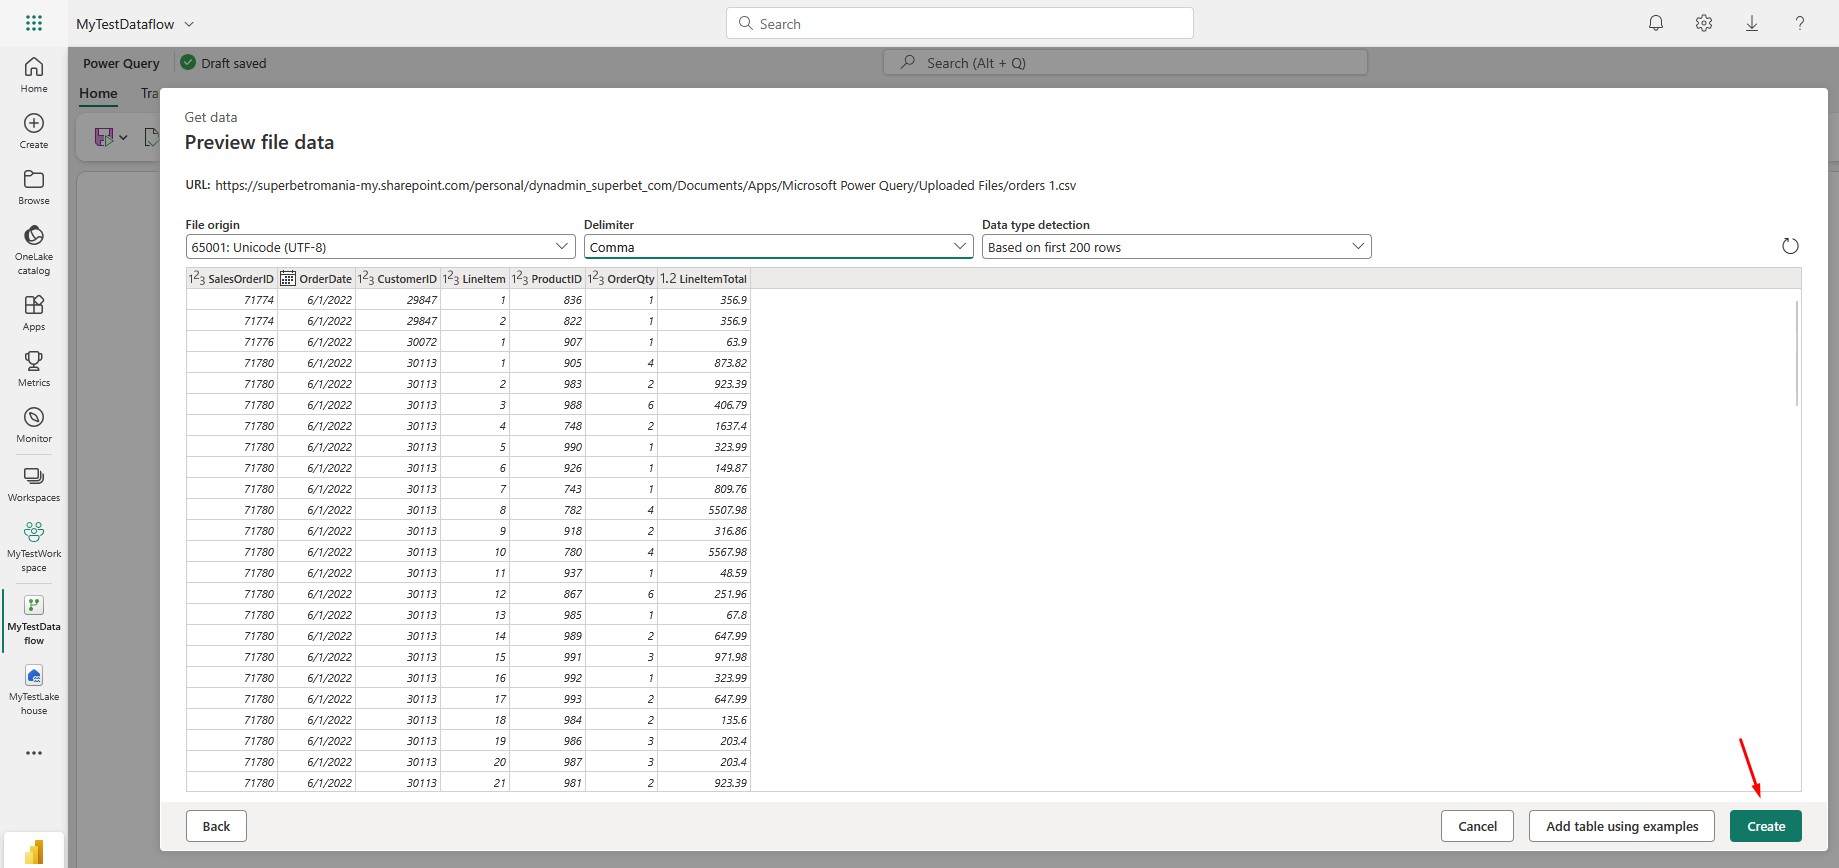
Choose the following options and then click Next to preview the data. After that, Create the data source:
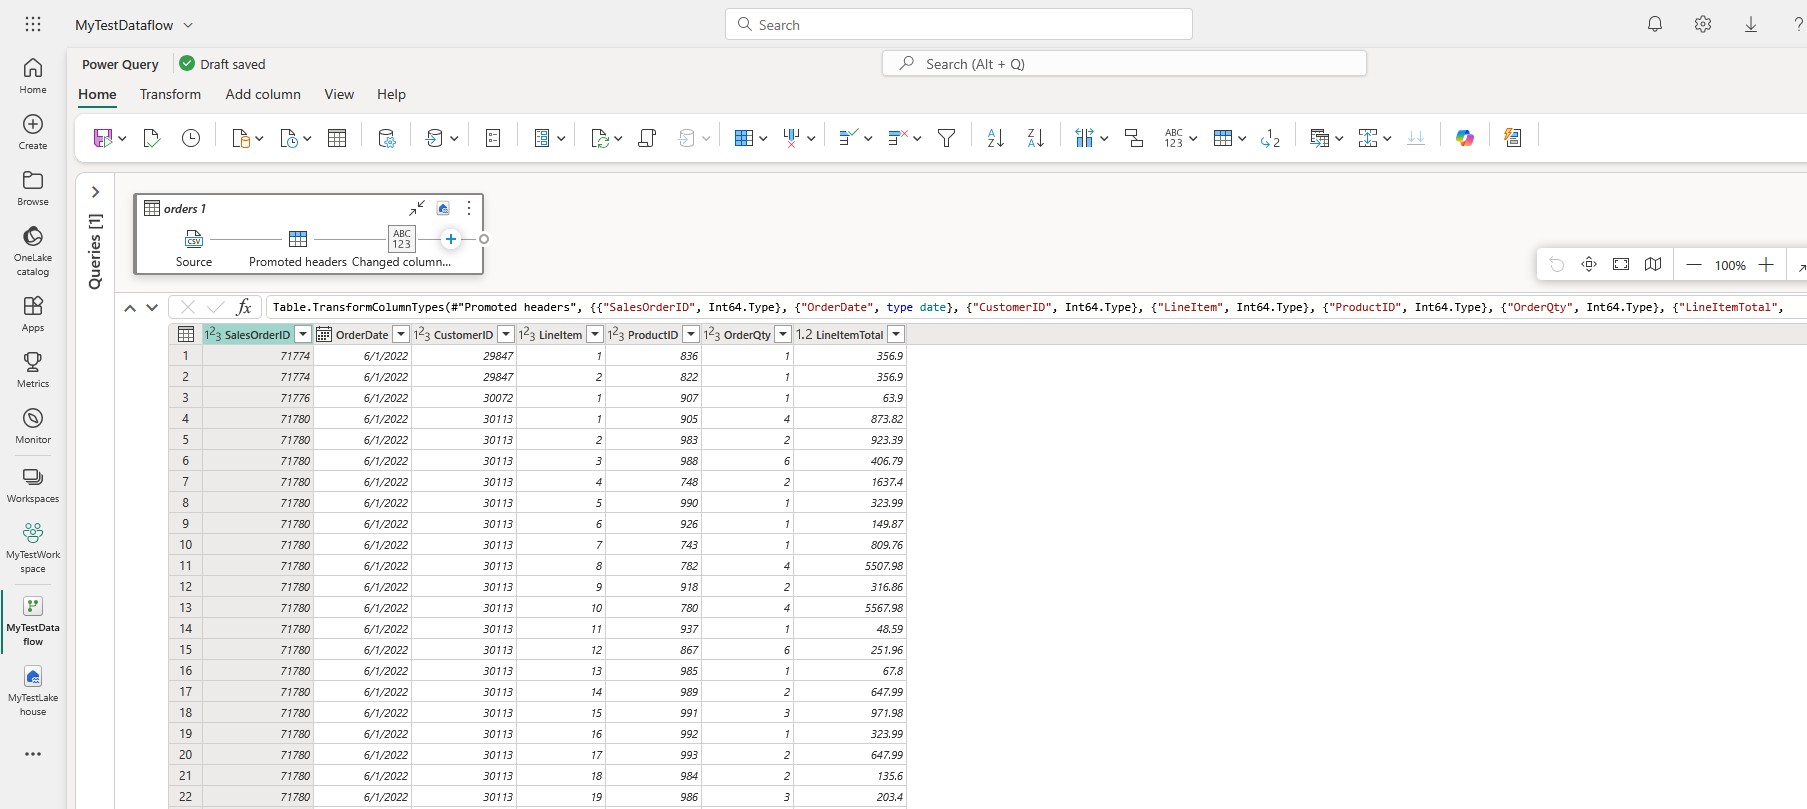
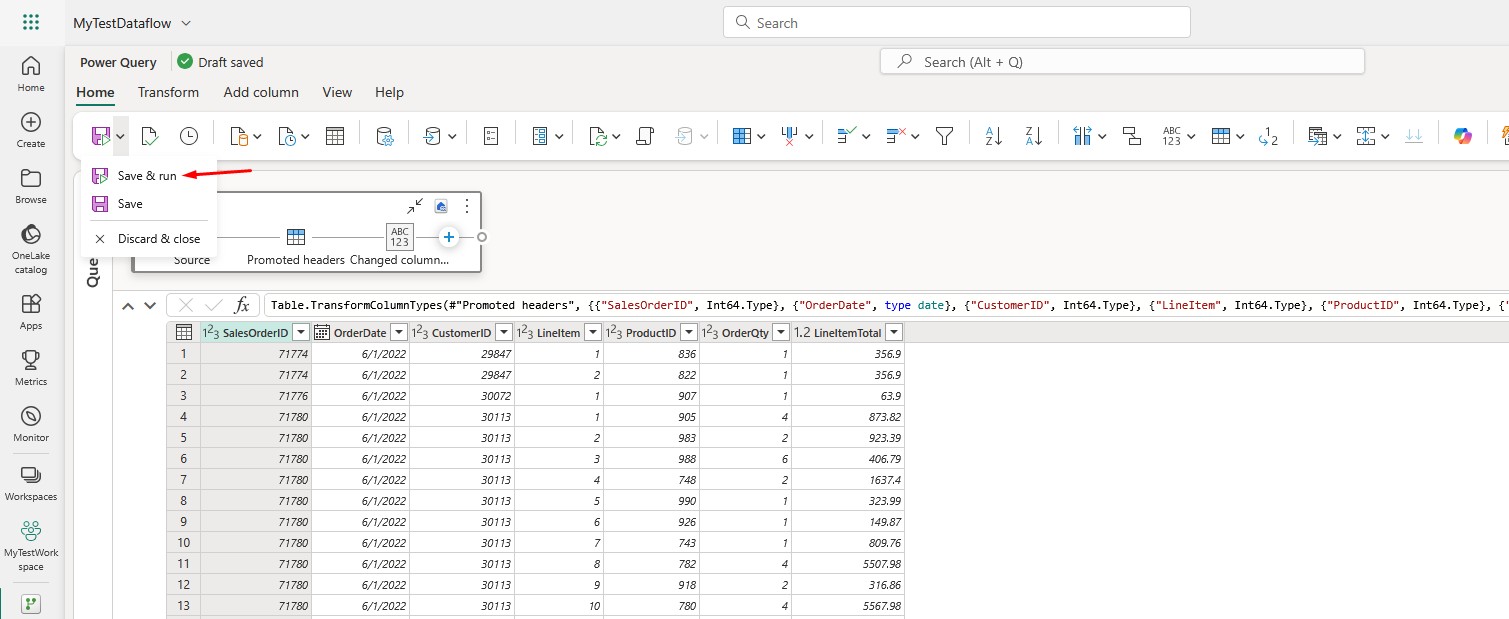
Power Query editor will open. Here you can transform the data, add custom columns etc.:
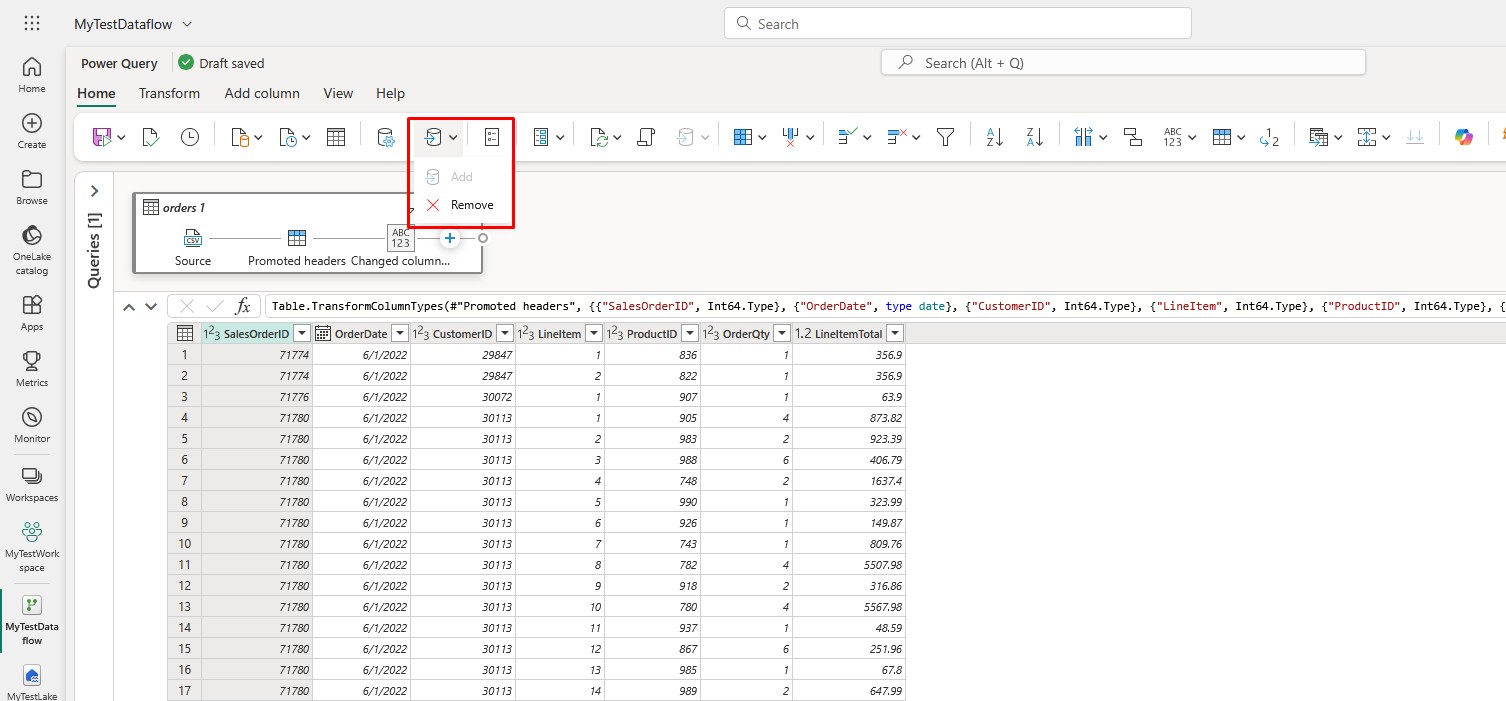
Your Lakehouse should be selected as a default data destination, but if not, you can change it here:
Last step is to Save and run the Dataflow:
That’s it! You’ve successfully loaded a CSV file into a table in Fabric using Dataflows Gen2. This covers the question: how do I load a CSV file into a table in Fabric. Go to your Lakehouse Tables, and check if the table and data are there.
Joining Data from a CSV with an Existing Lakehouse Table
Now I’ll show you how to take a CSV you’ve uploaded to the Files area and join it with an existing table in your Lakehouse. In my case, I already loaded orders.csv to a Lakehouse table called orders via Dataflows Gen2, and now I’ll upload customers.csv to Files folder and join them in a Fabric notebook. We will join file-based data with table-based data and write the results to a new table.
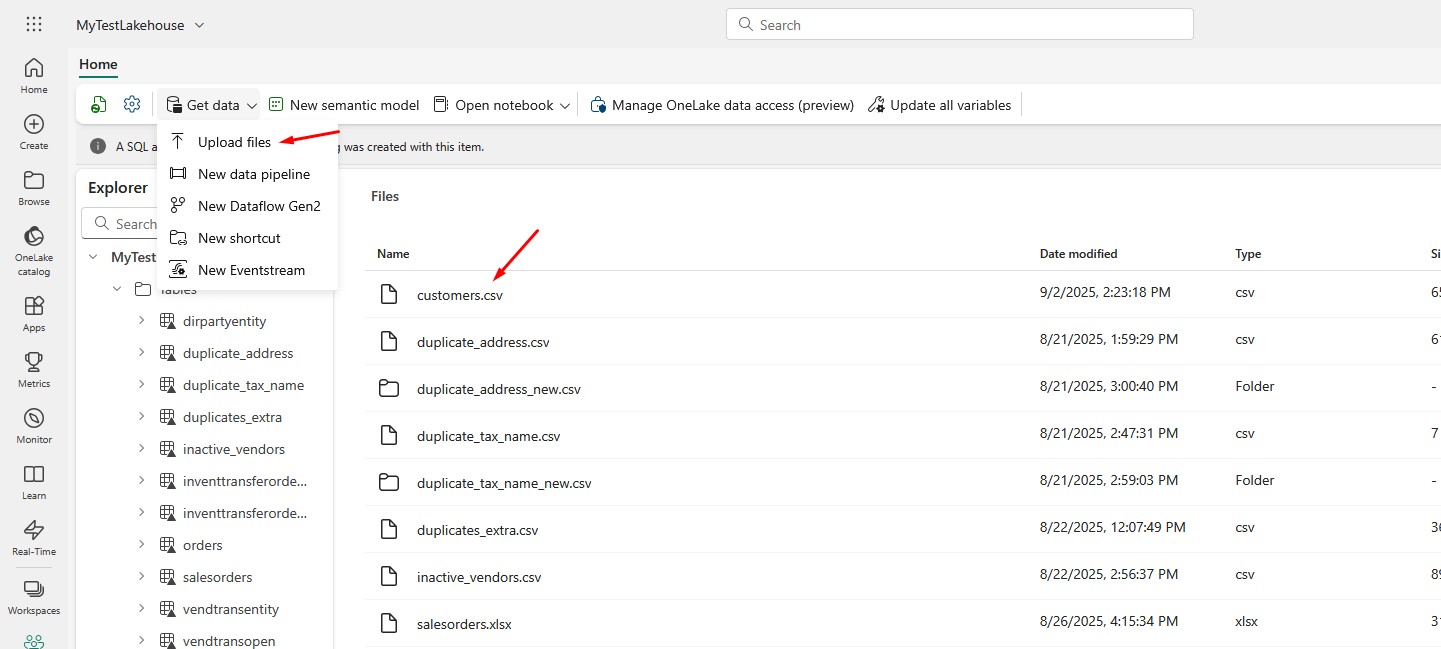
Upload the customers.csv file you downloaded here to Files folder:
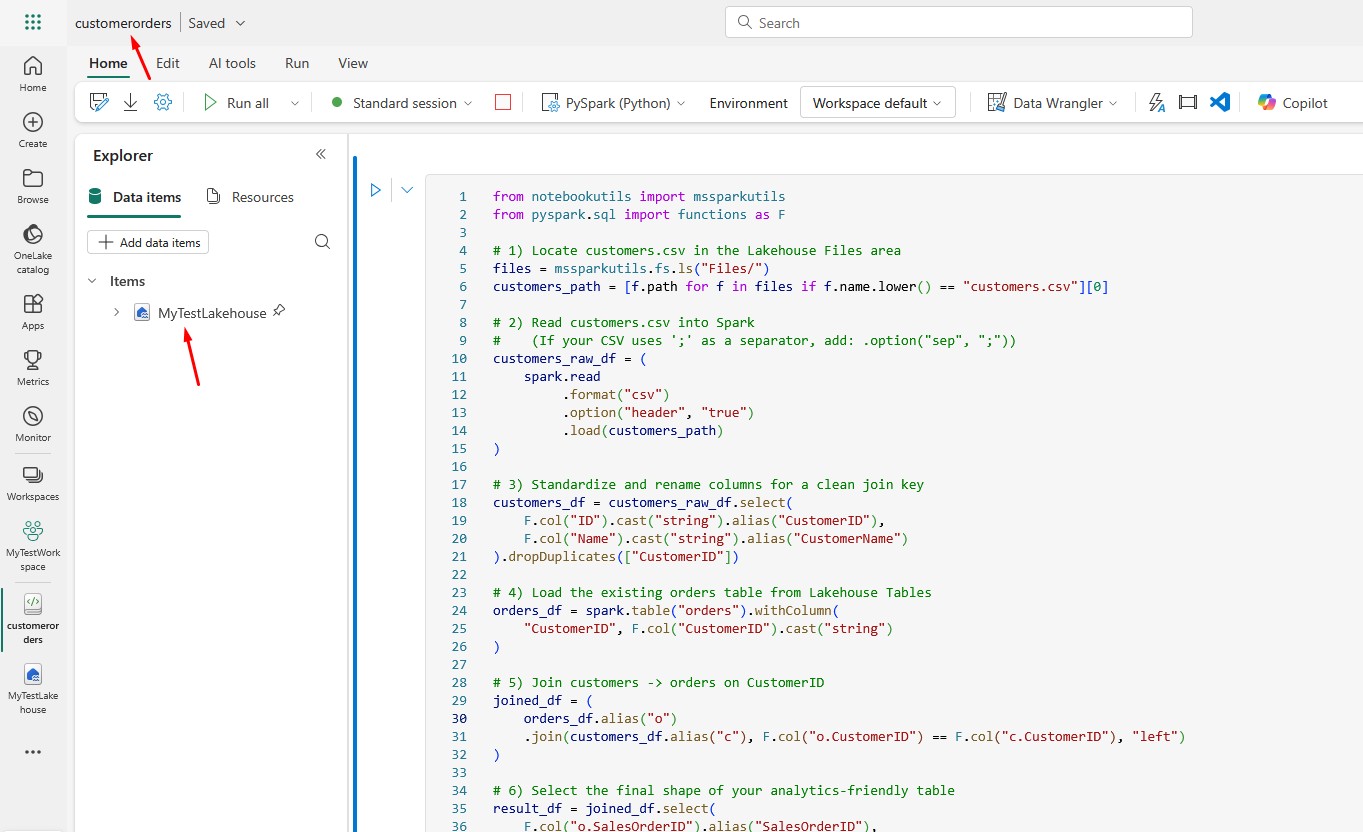
Now, create a new Notebook with the following code:
from notebookutils import mssparkutils
from pyspark.sql import functions as F

# 1) Locate customers.csv in the Lakehouse Files area
files = mssparkutils.fs.ls("Files/")
customers_path = [f.path for f in files if f.name.lower() == "customers.csv"][0]

# 2) Read customers.csv into Spark
#    (If your CSV uses ';' as a separator, add: .option("sep", ";"))
customers_raw_df = (
    spark.read
         .format("csv")
         .option("header", "true")
         .load(customers_path)
)

# 3) Standardize and rename columns for a clean join key
customers_df = customers_raw_df.select(
    F.col("ID").cast("string").alias("CustomerID"),
    F.col("Name").cast("string").alias("CustomerName")
).dropDuplicates(["CustomerID"])

# 4) Load the existing orders table from Lakehouse Tables
orders_df = spark.table("orders").withColumn(
    "CustomerID", F.col("CustomerID").cast("string")
)

# 5) Join customers -> orders on CustomerID
joined_df = (
    orders_df.alias("o")
    .join(customers_df.alias("c"), F.col("o.CustomerID") == F.col("c.CustomerID"), "left")
)

# 6) Select the final shape of your analytics-friendly table
result_df = joined_df.select(
    F.col("o.SalesOrderID").alias("SalesOrderID"),
    F.col("o.OrderDate").alias("OrderDate"),
    F.col("o.CustomerID").alias("CustomerID"),
    F.col("c.CustomerName").alias("CustomerName"),
    F.col("o.LineItem").alias("LineItem"),
    F.col("o.ProductID").alias("ProductID"),
    F.col("o.OrderQty").alias("OrderQty"),
    F.col("o.LineItemTotal").alias("LineItemTotal")
)

# 7) Write the result as a Delta table in your Lakehouse
result_df.write.format("delta").mode("overwrite").option("overwriteSchema", "true").saveAsTable("customerorders")
You can call the notebook customerorders. Make sure you select your Lakehouse as a data item:
How this code works:
mssparkutils.fs.ls("Files/")→ lists everything in your Lakehouse Files folder.- The list comprehension finds the full OneLake path for customers.csv.
spark.read.format("csv").option("header","true").load(customers_path)→ reads the CSV into a Spark DataFrame.- Columns are standardized:
ID→CustomerID(string) andName→CustomerName(string), then duplicates are removed onCustomerID. spark.table("orders")loads the orders table created earlier (via Dataflows Gen2 or your notebook), and we ensureCustomerIDis a string for a clean join.- A left join keeps all orders even if a customer name is missing.
- We select tidy, analysis-ready columns and write the result to a new table named customerorders in your Lakehouse.
After you run the Notebook, you will see the new (joined) table in your Lakehouse:
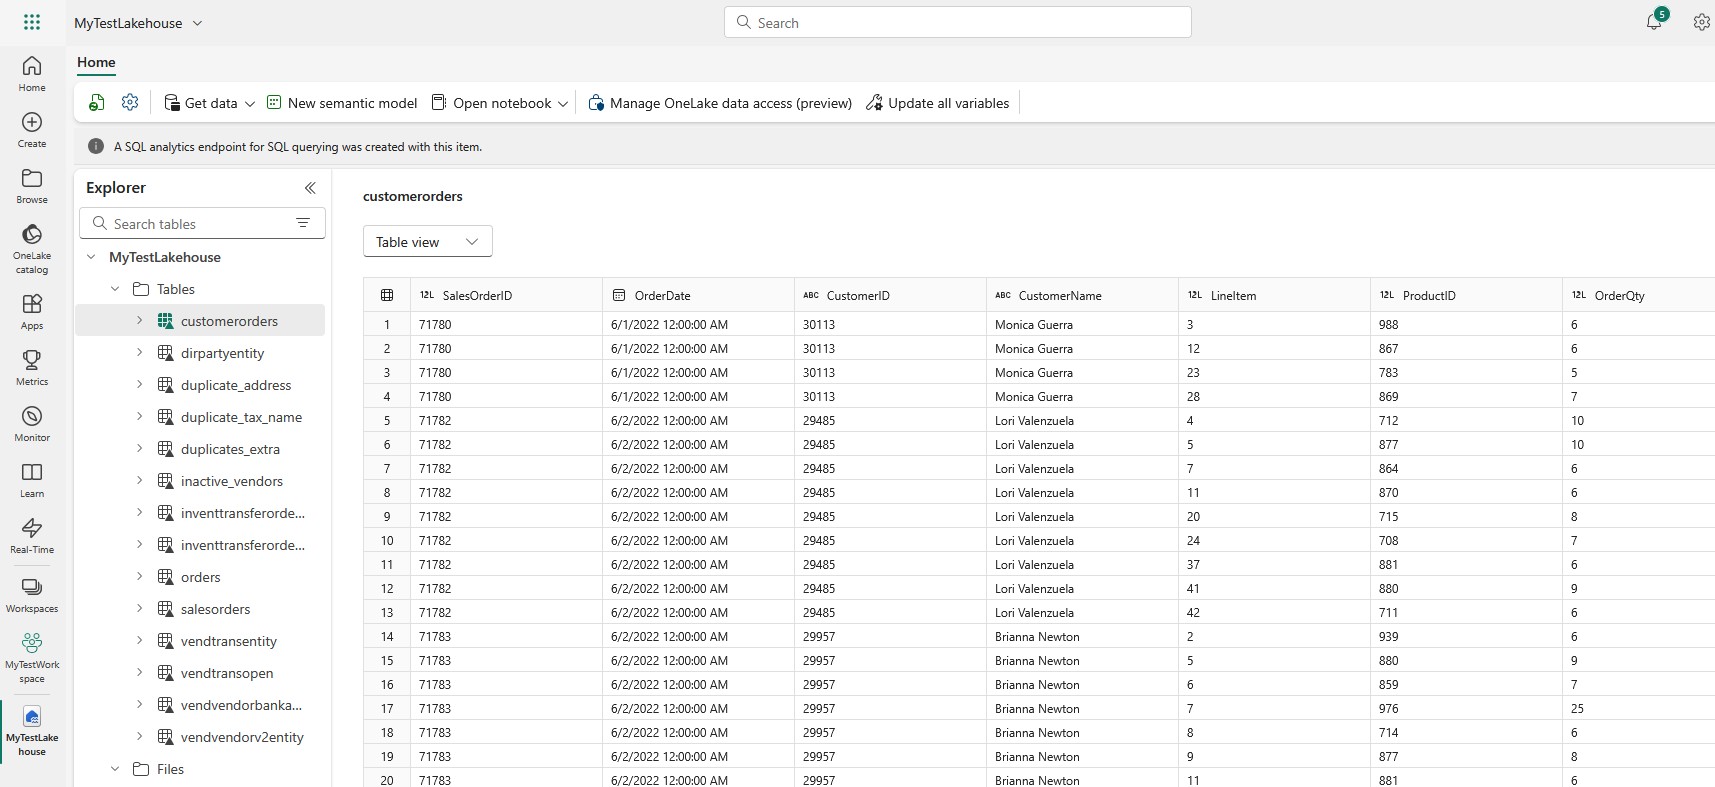
With this, you’ve covered the end-to-end path: upload CSV to Fabric, read it in a notebook, join with an existing Lakehouse table, and publish a clean, consumable table – exactly the kind of practical workflow readers look for when they search for things like: “microsoft fabric upload csv” and “how do I load a CSV file into a table in Fabric”.
Hope this helps you understand possible ways to load files into Fabric! If you’re just getting started with Microsoft Fabric, feel free to explore more of my blog posts here. Recently, I wrote a blog post on common error in Power BI: Microsoft SQL Integrated Security not supported, so make sure you check it out.
If you want to learn more about Microsoft Fabric Dataflow Gen2, make sure you check out this link. There is also a great book on Amazon called Learn Microsoft Fabric: A practical guide to performing data analytics in the era of artificial intelligence that covers some interesting topics.

How to Insert Data in SQL Database?

First Blog Post and My Journey
What Are Stored Procedures Used For in SQL
About The Author
Mika
Hi, I’m Mika. For the past 19+ years I've been working as a consultant, solution architect, and project manager for business applications. Now, I’m exploring data analysis, business analysis, and AI. Follow my blog for insights on enterprise systems, data analytics, and productivity tips.